Open NMS is a great program that allows you to detect and correct problems proactively rather than waiting for the helpdesk phone to ring and someone report an outage.
Open NMS allows you to monitor services and ports using custom configurations. In this example, we are going to create a custom polling service to monitor port 59183 which is being used by a TimeQ Plus server. The idea is to receive an alert when the TimeQ Plus service fails by monitoring the port status. You can adjust the service name and/or port number to configure a monitoring service that meets your specific needs.
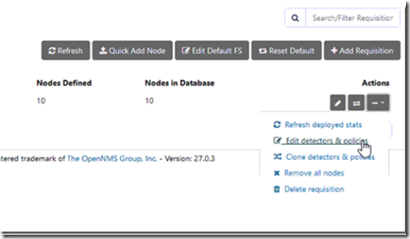
First we are going to create a detector. Go to admin –> Provisioningrequisitions –> EditDetectors&Policies
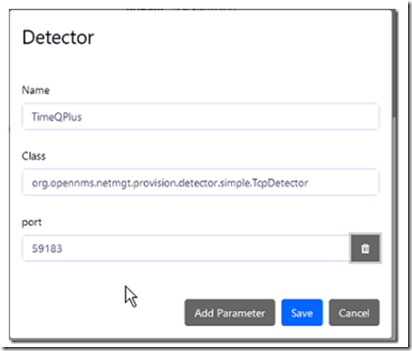
From there, click on the add detector icon. Give your detector a friendly name and select TCP class or whatever class best matches your service. It’s recommended not to use spaces and to stick with an alpha-numeric, short character names. Click add parameter and select port, then add the value 59183 (or whatever port you are going to monitor).
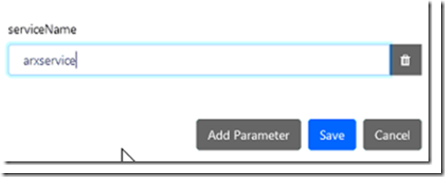
You can add additiona parameters by clicking on the add parameter button. For example, you can add the service name (to monitor the service) as well as a timeout value, number of retries, etc. In our example, we are using arxservice as the service name, 59183 as the port and requesting 5 retries before the service is deemed unreachable.
When finished, the new detector may look something like this:
Note: don’t forget to click save when exiting each menu, otherwise the settings will not be saved.
Navigate to admin –> provisioning requisitions –> device group and locate the device to poll.
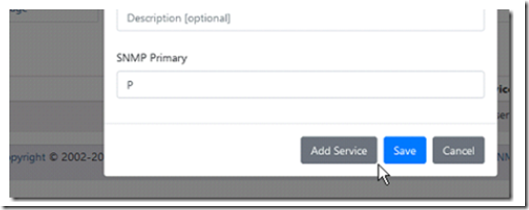
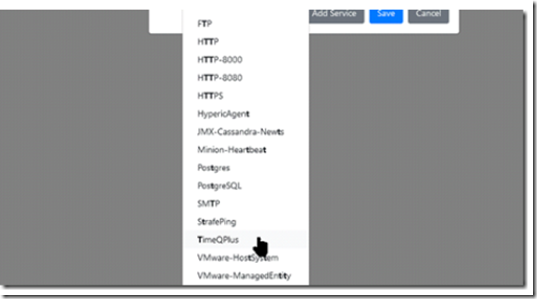
From the interfaces tab, click edit, the, select add service.
Select the newly created service from the drop down box and click save when finished.
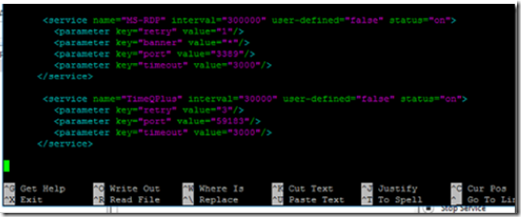
Open the shell, navidate to /etc/opennms and let’s edit the poller-configuration.xml file.
sudo nano /etc/opennms/poller-configuration.xml
Copy and paste the text below into the services section of the file, replacing the service name and port with your own. Note: The service name must match the name you used when creating the detector.
<service name=”TimeQPlus” interval=”30000″ user-defined=”false” status=”on”>
<parameter key=”retry” value=”3″/>
<parameter key=”port” value=”59183″/>
<parameter key=”timeout” value=”3000″/>
< /service>
Scroll to the bottom section and add a monitor service by copying and pasting the line below while replacing the monitor service name with your own. Again, the service name must match the name you chose for your service when you created the detector service.
<monitor service=”TimeQPlus” class-name=”org.opennms.netmgt.poller.monitors.TcpMonitor”/>
Exit and save the changes on your way out. You may need to reload the poller or restart the NMS server to load and use the new service.
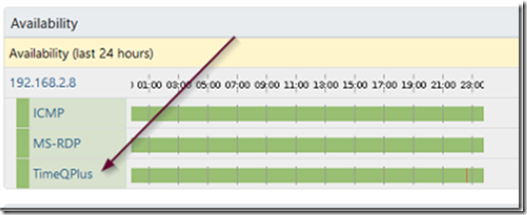
Once the service is loaded, navigate to the device and you should see the custom service displayed.
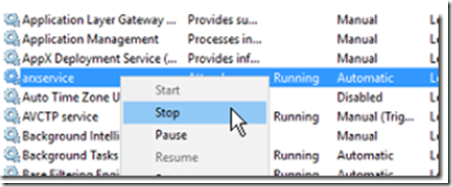
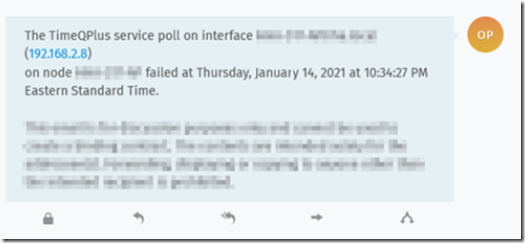
To test that the alarm works, simply stop the service from running or block the port using a firewall.
If configured properly, Open NMS will record the outage and (if you set up email alerts) it will alert the appropriate service team!

